Weather Sticker

Click for Mayo, Yukon Territory Forecast

Thursday, December 15, 2011

An Interpretation of Paleo and Future Climatology of Mayo Village

Paleoclimate of Mayo Village During Late Cretaceous Period (100 MYA)
The entire planet during the Cretaceous Period (100 MYA) was described as "greenhouse world" because of the high concentration of CO2 (g) from volcanic activity. The enhanced CO2 (g) in the atmosphere caused increased absorption of incoming and outgoing solar radiation, warming the entire planet and raising sea level. Warm, salty, shallow seas expanded across the globe and wind patterns were different due to altered tectonic locations.


Graphic Source: PaleoGeography and Geologic Evolution of
NorthAmerica: Late Cretaceous (100Ma).
http://www2.nau.edu/rcb7/namK100.jpg. Updated: 2011 JUL.
Accessed: 2011 DEC 6.
Westerly winds developed only seasonally leading to ocean circulation dominated by sub tropical gyres. The result of warm, high salinity seawater in combination with paleo-wind patterns enhanced themohaline circulation and global heat transport leading to decreased temperature gradient between the poles and equator.  Annual temperature averages around globe were 68-86° F warmer (WOW!), and annual precipitation was 28% more than the present.  
Mayo Village's paleo-lat/long is relatively the same as today: ~ 64° N, 135 °  W. Mayo's west coast tectonic locale has not changed too much in the last 100 Ma, but the climate has.  In fact flora and fauna fossil analysis has indicated that arctic latitudes experienced annual average temperatures around 77°  F, little to no cold season, and no permafrost. The warmer temperatures are a consequence of enhanced global heat transport, increased levels of atmospheric CO2(g),  and lack of albedo (to warm to snow!).  


Graphic Source: Karen Carr Studio Inc.
http://www.karencarr.com/tmpl1.php?CID=411.
Accessed: 2011 DEC 10. 

Maritime Mayo had less of an annual temperature range, higher temperatures and magnified precipitation amounts.The picture presented here is an interpretation by an Australian museum of what the Arctic vegetation looked like during the Cretaceous period. Other climatic factors influencing Mayo were very different than present day.  Absence of the present day Rocky Mountain Range in addition to shallow sea inundation made Mayo's topography relatively different than what it is at the present. Lack of orographic blocking and coastal locale caused the paleoclimate to be more humid and characteristically maritime  instead of present day semi arid,  continental. In fact, isotopic analysis of O16 indicates that annual average global precipitation was 28% more than presently.  The Yukon was not a source region for cP air masses as they it is today. Instead paleo-air masses effecting climate in this region were most likely similar to mT air masses of the present. 


This is a subjective climograph I constructed for this area. In order to figure out relative average paleo-temperatures for Mayo I added ~68
°  F to current day average temperatures and resulted in an average annual paleo-temperature of around 78°  F, very close to the 77°  F annual average arctic paleotemperature. To figure out the average paleo-precipitation amounts I used current data from Kodiak, AK weather station because it appears to have a similar present day,  maritime locale as Mayo  and than added 28% of that amount to account for the increased global paleo-precipitation amounts. 

Graphic Source: Composed by Qwyla Foutch, Data Source: Weather Channel: Kodiak AK. http://www.weather.com/weather/wxclimatology/monthly/graph/USAK0133 and 
http://www.worldweather.org/083/c01232.htm. Environment Canada. Canadian Climate Normals 1971–2000Accessed: 2011 DEC 12.

Present day climograph illustrates Mayo's large annual temperature range and low precipitation amounts. These are all due to the region's high latitude location, current wind and pressure systems, and  topography.
Graphic Source:  Composed by Qwula Foutch. Data Source:
http://www.worldweather.org/083/c01232.htm. Environment Canada.

Predicted FuturaClimate of Mayo Village, YT Based on Predicted Tectonic Movement


Above is  graphic representation of where Mayo (black star) will be located in 100 Ma. The future Mayo is still in the Northern Hemisphere but has shifted southwest to a new lat/long locale of ~ 50 ° N, 145-150 °  W.
   The predicted change in Mayo's location will alter  wind patterns and ocean circulation. Presently Mayo is effected by the Polar Easterlies and polar ocean gyres that mitigate anticyclonic pressure systems. In the future, the region's climate will most be effected by the Westerlies and  the futuristic  North Pacific Ocean Current. 
Graphic Sources: Comparison of Today and 100 Ma from now. http://www.physics.uc.edu/~hanson/ASTRO/LECTURENOTES/ET/S04/Earth/comp1.html.
Accessed: 2011 DEC 10.
 

The future mid latitude location of Mayo will change which air masses and jet streams influence the weather phenomena. Future tectonic arrangement will cause the North Pacific Ocean current to transport warm water from the equator to Mayo at an enhanced velocity. Weather will likely increase in severity as  summer time, mT and cT air masses conflict with mP air masses.  Future midlatitude cyclones bearing lots of moisture from the cold, polar oceans and warm, equator ocean will change the Yukon regions winter climate into a stormy, icy, humid climate. Enhanced solar angle and heating of the land will result in low pressure during the summer that will continue to encourage milder, but  cool and humid conditions one could expect to experience near coastal, northwestern US. I found these digital graphics online that mimic what I would expect Mayo Lake to look like in 100 million years from now. 
Graphic Source: Sadhu Ramasamy.  The traveler on Planet Earth. http://my.opera.com/sadhuvan/blog/index.dml/tag/MY%20FAVOUR. Accessed: 2011 DEC 15.
\


In 100 million years Mayo will be located on the south side, of the west coast within the North American Plate. The above video illustrates extensional forces and spreading within the North American Continent. This spreading out of the land will result in Horst/Graben systems i.e. Basin and Range type provinces with hills and lowlands. It is most wise to assume that the previous Rocky Mountain Range has already eroded and formed rock units that have been exposed through extensional tectonic processes. Mayo's future locale will be within this undulating topography. If Mayo is located within a lowland area, on the leeward side of a mountain it will be less effected by the increased precipitation caused by future atmospheric and ocean systems, and will be subjected to cold ponding. If Mayo is located on the windward side of a mountain range, the temperature and precipitation will increase substantially from current day averages. Fog (advection,sea, upslope) will become more prevalent throughout the area because of the conflicting oceanic temperatures, air masses and rugged topography. If Mayo
Graphic Source: YouTube, Citation: McDougal Littel. "Exploring Earth" http://www.classzone.com/books/earth_science/terc/content/visualizations/es0807/
es0807page01.cfm?chapter_no=visualization. Accessed: 2011 DEC 11.


Above is a subjective climograph I constructed using my interpretation of what the climate will be like in Mayo 100 Ma from now.  I increased the precipitation amounts to reflect what I believe to be a wet, stormy climate during the winter because of Mayo's new mide latitude, maritime locale between a polar ocean and warmer, subtropical North Pacific ocean. I also raised future temperatures to reflect a midlatitude, maritime, possibly highland locale. The annual temperature average reflects an increase from past conditions, as well as a decrease in range  because of the regions closer proximity to the equator. 
Graphic Source: Qwyla Foutch. Interpretative Climograph of Mayo 100 Ma into the Future.

Additional Sources:
Bice KL, Bralower TJ, Duncan RA, et al. Cretaceous Climate Ocean Dynamics: Future Directions for IODP. 2002 JUL 14-17. http://www.whoi.edu/ccod/CCOD_report.html#top Accessed: 2011 DEC 5.

Greenhouse Earth 100 MYA. School of Ocean and Earth Science and Technology, University of Hawai’i at Manoa. PPT. Accessed: 2011 DEC 5. www.soest.hawaii.edu/GG/FACULTY/POPP/Lecture9.ppt

Ludvigson G.A. Global Climate Change and the Cretaceous Greenhouse World. Iowa Department of Natural Resources. 1999. http://www.igsb.uiowa.edu/Mapping/greenhse/grnhouse.htm Accessed: 2011 DEC 5.
 

Saturday, December 10, 2011

A Reflection on the Differences in Climate Between Mayo, YT and Barcelona, ES


As observed in the climographs Mayo, YT and Barcelona, ES have differing climatic behavior. Mayo is classified as a dry, subarctic, taiga climate (Dfc) and experiences long, dry, severe winters, mild summers, and a large annual temperature range. Barcelona is classifiedas a warm, temperate, subtropical, Mediterranean climate (Csa) and experiences mild humid winter,  dry hot summers, and a small annual temperature range.   
  Graphic Source: Graphs made by Qwyla Foutch. Data Source: World Weather Information:Spain.Accessed: 2011 DEC 7. http://www.worldweather.org/083/c01232.htm. Environment Canada. Canadian Climate Normals 1971–2000 Accessed: 2011 DEC 7. 


Different climatic controls are acting upon the region that result in the contrast in climatological behavior. The primary climatic control is the difference in location. Mayo is located within the interior, on the northwestern side of the North American continent at a near arctic latitude. Barcelona is located midlatitude, on the eastern coast of the southwestern side of the European continent. Mayo’s extreme weather and large annual temperature range exemplifies continental climatology whereas Barcelona's mild weather and smaller annual temperature range portray maritime climatology.

Graphic Source: 
Peel, M. C. and Finlayson, B. L. and McMahon, T. A. (2007). "Updated world map of the Köppen-Geiger climate classification". Hydrol. Earth Syst. Sci. 11: 1633-1644. ISSN 1027-56EDITED/ACCESSED: 2011 DEC 8.
 The arctic latitude of Mayo causes a lack of sunlight during the winter that, when paired with a continental locale, brings severely cold temperatures and snow accumulation. Unlike arctic Mayo, mid latitude Barcelona receives an abundance of sunlight during the winter and mild temperatures that attract major tourism
Graphic Source:
NewsMiner. Fairbanks Daily. http://newsminer.com/pages/features_our_town/push?x_page=2&class=&rel=next&per_page=2&instance=best_photo1. Accesed: 2011 DEC 7.
 Bacivarov I. Beach in Barcelona winter. Panoramio. http://www.panoramio.com/photo/35569027 Accessed: 2011 DEC 7.


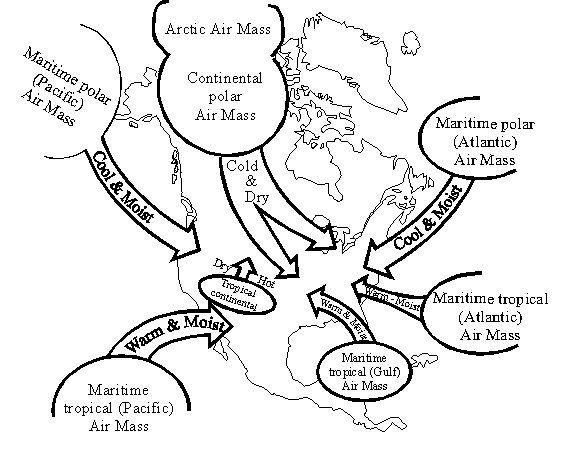
The second contrasting climatic factors are pressure and wind systems. Mayo is effected primarily by the polar easterlies and experiences strong, stable pressure ridges in the winter and weak, unstable pressure troughs during the summer. Barcelona is effected by the Westerlies, and experiences midlatitude cyclonic activity during the winter as cP/mP air interacts with mT air masses. During the summer in Barcelona mT air masses dominate and the presence of a subtropical pressure ridge brings stable, drought like conditions. Overall Mayo is dry in the winter and wet during the summer; Barcelona climate is the opposite with very wet, mild winters and drier, mild summers.             
Satellite Graphic Sources: intellicast.com. Infrared Satellited: Barcelona, ES. http://www.intellicast.com/Global/
/Infrared.aspx 
Accessed: 2011 DEC 8; Satellite Images: Yukon. 
Environment Canada.  
http://www.weatheroffice.gc.ca/satellite/index_e.html Accessed: 2011 DEC 8 


The final contrasting climatic factors are proximity to mountains/highlands, water, and urban heat island effects. Mayo Village's regional topography is full of alternating highland and valleys, with close proximity to mountain ranges. Mayo’s dry, cold climate is enhanced by orographic blocking and cold ponding. 
Barcelona is located on the coast of the Mediterranean sea and its climate, while effected by orographic blocking, is not dominated by effects of northern mountain ranges.  Instead, unlike Mayo Village, the moderating effects of the Mediterranean Sea, keep temperatures comfortable both summer and winter in Barcelona.   
Barcelona is a highly populated, coastal city in Spain and it's local climate has been influenced by vegetation changes/disruptions, large buildings, and/or increased atmospheric pollutants that all lead to an urban heat island effect. Mayo is a fairly isolated village with no large buildings or major sources of atmospheric pollution and does not experience urban heat island effects of local climate. 


 Graphic Sources: Kookynet.net. Canada: The Yukon and A Short Trip Through NW Territories AUG/SEPT. http://www.kookynet.net/23-yukon-nwt.html Accessed: 2011 DEC 8.
CORFU. Barcelona, Spain. http://www.corfufp7.eu/home/page2890.html. Accessed: 2011 DEC 8. 

Additional Sources:    

Grue, NW. Barcelona Weather and Climate Blog. Last Updated: 2011 DEC 6. http://barclimate.blogspot.com/ Accessed: 2011 DEC
Lutgens, F.K. Tarbuck E.J. 2010. The Atmosphere: An Introduction to Meteorology.  Pearson Education. Chapter:15
Ritter, Michael E. The Physical Environment: an Introduction to Physical Geography.
2006. Date visited. http://www.uwsp.edu/geo/faculty/ritter/geog101/textbook
/title_page.html


Friday, December 2, 2011

Mayo Village Climatology


Mayo Village is located north of a humid continental climate, but south of the polar tundra within the frozen interior of Canada. Mayo exemplifies all the characteristics of a subarctic, taiga climate (Dfc).  These climates tend to undergo long, and severely cold winter with little sunlight and a very short, mild summers with an abundance of low angle insolation. Subarctic climates characteristically exhibit large annual temperature ranges because of the large differences in winter and summer weather and very short or no spring/autumn seasonality; Mayo’s annual temperature rang is ~70 °F.
Graphic Source: Kottek, M., J. Grieser, C. Beck, B. Rudolf, and F. Rubel, 2006: World Map of the Köppen-Geiger climate classification updated. Meteorol. Z., 15, 259-263. DOI: 10.1127/0941-2948/2006/0130. http://koeppen-geiger.vu-wien.ac.at/present.htm Edited: Qwyla Foutch, 2011 Nov


The dominant Polar easterlies wind patterns in the Yukon region prepare this area to be a source for continental polar air masses. Below freezing surface temperatures during the winter are not suitable for rising parcels of air and dry, stable, high-pressure systems occur. In the summer, movement of the sun increases received solar insolation. The seasonal shifting of the pressure systems causes a weak, pressure trough to occur and greater precipitation ensues. The accumulation of a deep snow pack in winter is dependent on the lack of insolation required for melting. Most precipitation actually falls in the form of rain during the summer months. Graphic Source: Sabahat, S. Topic: Geography. Css Forum. http://www.cssforum.com.pk/css-optional-subjects/group-d/geography/48830-topic-wise-geography-notes-physical-geo-5.html Accessed: 2011 Nov 29
Taiga climates are associated with the northern coniferous forests like those found in around Mayo Village. The vegetation here is primarily comprised of scrawny spruce, fir, larch and birch trees. The Mayo community tries it's best to moderatesintrusive species, and because of the small populous they've been successful.
Graphic Source: Donohue, C. Skolai Images. http://www.skolaiimages.com/stock/displayimage-1009-Taiga-Forest-boreal-forest-Yukon-Territori.html Accessed: 2011 Nov 29
Macroscale climatic controls in Mayo are it’s northern, near arctic latitude and continental location. Mayo Village lies at a latitude of 63.6° N, just outside the Arctic Circle. Consequentially, this region experiences minimal solar radiation at an extremely low angle in the winter, and maximum solar radiation at a low angle during the summer. The seasonal variability in insolation is reflected in large annual temperature ranges. Mayo has an annual temperature range of ~70°F and it’s latitudinal locale explains why Mayo is so cold in winter (no sunlight) and fair in summer (~20 hours of low angle sunlight). The movement of the sun in respect to the earth also drives the shifting of pressure systems that effect Mayo’s climate (read below). 
Graphic Source: Milan, S. university of Leicester, Dept of Physics. Updated: 2007 Oct. http://www.ion.le.ac.uk/~ets/phd/RSPP_PhDs.html Accessed: 2011 Nov 29
Mayo Village is full of alternating valleys and highlands, making this region very particular to massive downslopes movements of cold, dry katabatic winds from the highlands that settle in the valley village of Mayo. The cold air ponding can lead to extreme decreases in temperatures in the lowlands, limiting flora growth to certain elevations. The effects of cold air ponding are intensified in Mayo winter because the area is already bitterly cold. The lowest temperatures within the Yukon Territory occur because of this phenomenon.  
Graphic Source: Edwards, M. 2009. Mt Haldane, Downtown Mayo Yukon. http://www.flickr.com/photos/michael_edwards/3328053071/. Accessed: 2011 Nov 30.
Mayo Village’s semi arid affection is an outcome of high pressure systems, polar wind patterns, and orographic blocking. Mayo Village is located in the dry shadow of the leeward side of the most northern part of the North American Cordillera Range. The rain shadow that occurs in Mayo is a result of the St Elias range that blocks the warm, moist air from the North Pacific Ocean and the Mackenzie Mt range to the north which disrupts any maritime effects from the Bering Sea. The most precipitation the area receives is during the summer because of weak convective, cyclonic system and the surplus of water via evapotranspiration processes. Graphic Source: Peepre,J. http://www.yukonwildrivers.ca/?page_id=9 Accessed: 2011 Dec 1.

The graphs above represent the total precipitation and mean temperatures in the months of January and July from 1925-2011. The trend on the temperature graph indicates that Mayo’s climate is getting warmer, especially in the winter. The trend on the precipitation graph illustrates in increasing amount of precipitation in the summer months. The climographs are also a great representation of the contrasting climate differences between summer and winter that are characteristic of subarctic regions.  

Graphic Source: Graph made by Qwyla Foutch, data source:  


Additional Sources:
       Lutgens, F.K. Tarbuck E.J. 2010. The Atmosphere: An Introduction to Meteorology.  Pearson Education. Chapter:15

       NSIDC. Arctic Climatology and Meteorology Education Center.  National Snow and Ice Data Center.  Accessed: 2011 NOV 29. http://nsidc.org/arcticmet/

       Pojar J, Stewart AC. Chapter 17: Spruce-Willow-Birch Zone. http://www.for.gov.bc.ca/hfd/pubs/docs/srs/Srs06/chap17.pdf Accessed: 2011 NOV 30