Paleoclimate of Mayo Village During Late Cretaceous Period (100 MYA)
The entire planet during the Cretaceous Period (100 MYA) was described as "greenhouse world" because of the high concentration of CO2 (g) from volcanic activity. The enhanced CO2 (g) in the atmosphere caused increased absorption of incoming and outgoing solar radiation, warming the entire planet and raising sea level. Warm, salty, shallow seas expanded across the globe and wind patterns were different due to altered tectonic locations. |
Graphic Source: PaleoGeography and Geologic Evolution of NorthAmerica: Late Cretaceous (100Ma). http://www2.nau.edu/rcb7/namK100.jpg. Updated: 2011 JUL. Accessed: 2011 DEC 6. |
Mayo Village's paleo-lat/long is relatively the same as today: ~ 64° N, 135 ° W. Mayo's west coast tectonic locale has not changed too much in the last 100 Ma, but the climate has. In fact flora and fauna fossil analysis has indicated that arctic latitudes experienced annual average temperatures around 77° F, little to no cold season, and no permafrost. The warmer temperatures are a consequence of enhanced global heat transport, increased levels of atmospheric CO2(g), and lack of albedo (to warm to snow!).
 |
| Graphic Source: Karen Carr Studio Inc. http://www.karencarr.com/tmpl1.php?CID=411. Accessed: 2011 DEC 10. |
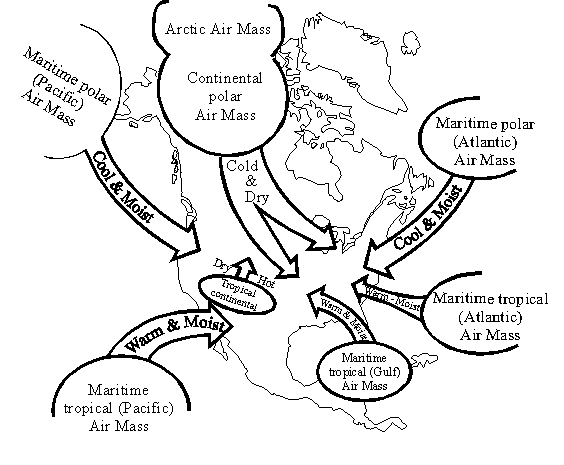
Maritime Mayo had less of an annual temperature range, higher temperatures and magnified precipitation amounts.The picture presented here is an interpretation by an Australian museum of what the Arctic vegetation looked like during the Cretaceous period. Other climatic factors influencing Mayo were very different than present day. Absence of the present day Rocky Mountain Range in addition to shallow sea inundation made Mayo's topography relatively different than what it is at the present. Lack of orographic blocking and coastal locale caused the paleoclimate to be more humid and characteristically maritime instead of present day semi arid, continental. In fact, isotopic analysis of O16 indicates that annual average global precipitation was 28% more than presently. The Yukon was not a source region for cP air masses as they it is today. Instead paleo-air masses effecting climate in this region were most likely similar to mT air masses of the present.
 |
This is a subjective climograph I constructed for this area. In order to figure out relative average paleo-temperatures for Mayo I added ~68° F to current day average temperatures and resulted in an average annual paleo-temperature of around 78° F, very close to the 77° F annual average arctic paleotemperature. To figure out the average paleo-precipitation amounts I used current data from Kodiak, AK weather station because it appears to have a similar present day, maritime locale as Mayo and than added 28% of that amount to account for the increased global paleo-precipitation amounts. Graphic Source: Composed by Qwyla Foutch, Data Source: Weather Channel: Kodiak AK. http://www.weather.com/weather/wxclimatology/monthly/graph/USAK0133 and http://www.worldweather.org/083/c01232.htm. Environment Canada. Canadian Climate Normals 1971–2000Accessed: 2011 DEC 12. \ |
Graphic Source: YouTube, Citation: McDougal Littel. "Exploring Earth" http://www.classzone.com/books/earth_science/terc/content/visualizations/es0807/
es0807page01.cfm?chapter_no=visualization. Accessed: 2011 DEC 11.
Additional Sources:
Above is a subjective climograph I constructed using my interpretation of what the climate will be like in Mayo 100 Ma from now. I increased the precipitation amounts to reflect what I believe to be a wet, stormy climate during the winter because of Mayo's new mide latitude, maritime locale between a polar ocean and warmer, subtropical North Pacific ocean. I also raised future temperatures to reflect a midlatitude, maritime, possibly highland locale. The annual temperature average reflects an increase from past conditions, as well as a decrease in range because of the regions closer proximity to the equator.
Graphic Source: Qwyla Foutch. Interpretative Climograph of Mayo 100 Ma into the Future.
Additional Sources:
Bice KL, Bralower TJ, Duncan RA, et al. Cretaceous Climate Ocean Dynamics: Future Directions for IODP. 2002 JUL 14-17. http://www.whoi.edu/ccod/CCOD_report.html#top Accessed: 2011 DEC 5.
Greenhouse Earth 100 MYA. School of Ocean and Earth Science and Technology, University of Hawai’i at Manoa. PPT. Accessed: 2011 DEC 5. www.soest.hawaii.edu/GG/FACULTY/POPP/Lecture9.ppt
Ludvigson G.A. Global Climate Change and the Cretaceous Greenhouse World. Iowa Department of Natural Resources. 1999. http://www.igsb.uiowa.edu/Mapping/greenhse/grnhouse.htm Accessed: 2011 DEC 5.


